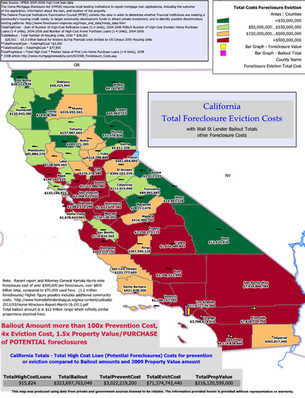
California by County
Shaded by Foreclosure eviction costs estimated at $77,935 per foreclosure. High cost loans (potential foreclosures) proxy for foreclosures. The bailout amount for CA is estimated at over $320 billion, over 4x the eviction costs which include lender costs as well as community costs. Equity loss also may be included. Possibly a conservative estimate given other estimates of over $300 thousand per foreclosure or 4x estimate used. Even in high priced CA the bailout amount share for CA would allow for the purchase outright of 1.5 times as many potential foreclosures as noted. Note that high foreclosure eviction costs (red - over $500 million in county) do not appear to follow usual population patterns of coastal versus central areas. 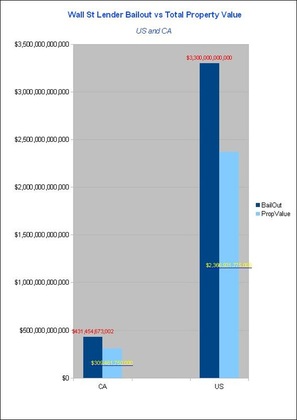
Chart demonstrates scale of bailout for Wall St lenders surpassing the value of purchasing ALL properties in potential foreclosure. Based on high cost conventional loans with estimate of 17% to 20% sub prime loans per US Census. Reflects flow of money from bailout to Wall St lenders and investors out of proportion to foreclosure crisis problem. Conservative estimate if you consider additional 9 TRILLION dollars in loans and funding. Nearly 3 x amount reflected above.
Loan modification denials, lack of legal support and choking of economy (no jobs, no investment) DOES NOT ADD UP! Sen Bernie Sanders news release 12/01/10 “The estimated $3.3 trillion in liquidity and more than $9 trillion in short-term loans and other financial arrangements dwarf the $700 billion Treasury Department bank bailout out signed into law under President George W. Bush.” Total Property Value – 2007 Peak Average Sales Price ($325,000) * Potential Foreclosures Wikipedia chart Potential Foreclosures - Sum of High Cost Original First Purch and First Refinance HMDA (2004-2006) High cost loans are viewed as a good proxy for foreclosures HMDA data Total of over 7 million high cost conventional loans for US appears in line with 3 to 4 million foreclosures. Total of nearly 1 million in CA Difference possibly due to duplicate purchase/refinance properties and foreclosures in process or off the books. Maps deduct non-owner (investor) purchase loans so figures may differ. 
This chart reflects cost and savings of preventing foreclosure vs allowing foreclosure to go through with eviction of homeowner for the United States. Foreclosure results in costs to community and loss of equity. Estimated cost of foreclosure is $77,935. Cost of workout is $3,300 as estimated in following article in 2008. Foreclosure costs
Savings dwarf amount of HAMP in 2009 yet Nearly $2 billion is more than half required to pursue workout for all potential foreclosures, total costs of around $3 billion with estimated cost of $77,935 per foreclosure at above link. This could be a low figure. CA est at $300,000. Note that anti-government, deficit obsessed tea party candidates that were sponsored by billionaires only focused on TARP which was a fraction of total amount of real bailout. There have probably been a fraction of workouts that could have been paid for due to mismanagement and possible cover up of illegal actions or fraudulent loans as properties in foreclosure pile up with revolving door of modifications or legal stall tactics. Even worst case scenario of costs (over $567 billion if full eviction pursued) are dwarfed by amount of bailouts for lenders in first chart of over $3 trillion or 6x. Possible differences in values may be attributable to lenders saving for possible legal action, hoarding profits or lenders and/or investors cashing in on insurance or legal cases themselves. Economy has stagnated keeping foreclosures high with no resolution. Current Wall St strategy of letting investors run through foreclosures will result in worst case scenario and potentially crash the economy worse than without the bailouts. Only sensible road to settlements would seem to be providing homeowners with legal funds and have Wall St and Washington focus on the economy instead of manufactured crises such as deficit ceiling debate. |
Report/Data Overview
Accompanying charts attempt to demonstrate the actual scale of bailouts that lenders and Wall St received during the financial crisis. It is hoped that there can be an attempt to measure or at least recognize the impact on our communities. Foreclosures are difficult to track and this approach may not meet S&P standards although toxic investments did while our country does not it seems. The hope is that we take a step back and use our common sense as the founders of our country hoped.
To the left are a series of charts and maps depicting US totals and California totals. Since the housing market is used by Wall St as an "uncertainty" crutch to depress the economy further while claiming that any taxes on corporations or the wealthy will hurt the recovery, the attempt is to relate the number of foreclosures and their value to the amount of money Wall St received at our expense. It seems clear that the amount received is a MULTIPLE of original bad loans and actually is enough to completely pay off "toxic" properties. Instead of placing the blame on homeowners it would make sense to focus on the lenders and institutions that allowed "bad" loans to multiply into toxic assets. To not assist homeowners and even deny access to the justice system while sabotaging the economy can only be described as malicious and criminal. The CA map reflects the data by county. I will post other states as this site allows until I can upgrade the site. I will work to post as much as I can with the hope that not only distressed homeowners but their neighbors and representatives will take note and ask the basic questions. Other pages on the site attempt to give a practical approach for the individual homeowner and communities from personal experience and the valiant efforts from the internet community. The Overview topics are presented to provide a context. As I continue my own personal struggle which is over three years with the foreclosure trap seemingly getting tighter, the hope is that my experience will help those getting started or those feeling trapped themselves. There are very good tools available where we can build on the spirit of collaboration and cooperation that is out there in the real America. There are many possibilities I believe to use this information to have our voices heard and to get us back on track. I appreciate any donations which I hope to distribute to other distressed homeowners as well. I can also provide custom reports for local communities and for community, non-profit and business applications. My goal will be to use portions of my profits towards the effort of keeping people in their homes. For now I'm hoping this can help even one homeowner develop a plan to get out of their trap. Future updates will provide more information and tools for ordering data, maps or reports. |
Foreclosure Intelligence
